Data TransparencyLive-Source VerifiedReproducibleVerified 2026-06-11
🔬 Methodology & Data Validation
Show Your Work — The Data Vigilante
Every number in this audit, sourced and reproducible
Data Validation — Live-Source Verified
Every statutory value driving the indices was checked against a live primary source on 2026-06-11. This is the assertion table the analysis notebook runs on load.
✅ EXACT = matches primary source to the dollar. ⚠️ = correct but methodology-dependent; see notes below.
Index Formulas
BAI = Max Weekly Benefit ÷ Median Weekly Housing Cost | Below 1.0 = systemic failure
WBI = Taxable Wage Base ÷ Average Annual Wage
MIPI = (Earnings − Disregard Threshold) ÷ Max Weekly Benefit
Housing Gap = Weekly Housing − Max Weekly Benefit ($/week deficit)
Employer Gap = (Expected Base − Statutory Base) × DOL Effective Rate × Covered Employment
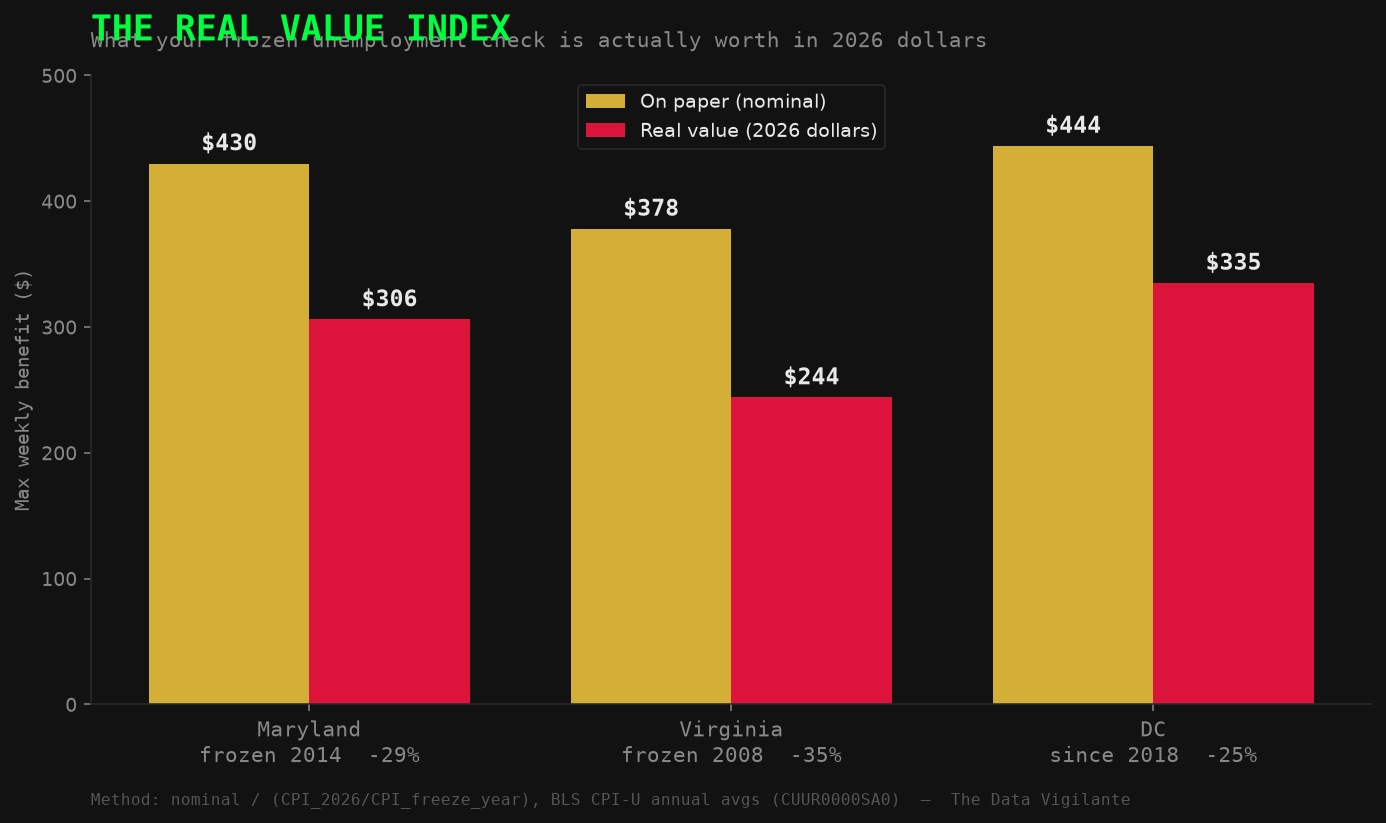
Real Value Index — what a frozen benefit is really worth
A frozen number isn't static — inflation cuts it every year, without a vote. The Real Value Index adjusts each frozen maximum benefit by BLS CPI-U to its 2026 purchasing power.
RVI = Max WBA ÷ (CPI₂₀₂₆ ÷ CPI_base_year)
State
Frozen at
Since
Real value 2026
Erosion
Maryland
$430
2014
~$306
−29%
Virginia
$378
2008
~$244
−35% (worst)
DC
$444
2018
~$335
−25%
Method: BLS CPI-U annual averages; 2014→2026 anchor 40.67% (in2013dollars/BLS). Virginia froze in 2008 — the longest freeze and worst erosion. Confirm exact figures against the BLS calculator before citing to the dollar.
Why Comparative Static Baselines?
This analysis anchors to three specific years — 2010, 2018, 2026 — rather than a continuous time-series. Benefit caps, wage bases, and disregard thresholds change through discrete legislative acts, not gradual drift. Anchoring to the same three moments across all three jurisdictions makes the policy decay visible and comparable. A moving average would obscure the step-function nature of the neglect — the whole point is that these numbers don't move for years at a time, then jump.
Housing Cost Methodology — The Most Consequential Choice
This is the single most important methodological decision in the audit, and it deserves explicit disclosure. The Weekly_Housing column determines whether a jurisdiction's BAI lands above or below the 1.0 survival threshold. With Virginia's corrected $430 cap, the VA 2026 outcome depends entirely on which housing source is used:
HUD FMR 2-BR state median (~$293/wk): VA BAI = 1.47 (well above)
Market-rate average (used in this audit, $420/wk): VA BAI = 1.02 (barely above)
Northern VA market rate (~$550+/wk): VA BAI = 0.78 (below)
This audit uses a market-rate weekly proxy rather than HUD FMR, on the reasoning that claimants face market rents, not subsidized FMR ceilings. This is a deliberately conservative-to-middle choice. A HUD-only methodology would make every jurisdiction look better; a Northern VA / DC-metro methodology would make them look worse. The honest statement: the direction of decay is robust across all three methods; the exact threshold-crossing year for Virginia is methodology-sensitive.
Honest Limitations
FEC contribution categorization uses keyword matching on contributor names — approximate, and captures only 0–30% of each member's total. See the Political Layer methodology disclosure for the full accounting and the correction roadmap.
Self-funding detection currently uses last-name matching and over-excludes joint-committee transfers for Kaine, Warner, and Hoyer. Only David Trone has verified candidate self-loans. Correction logged in OPTIMIZATIONS.md #23.
Employer gap uses the 2010-ratio method (Method B). Alternative methodologies (full wage base, CPI-only, national peer average, wage-growth index) produce different dollar figures — see source code for scenarios A–E.
BLS wage and employment data are 2024 annual averages; 2026 figures are projected forward.
Committee assignments reflect the 119th Congress (2025–2027) and change each Congress.
OpenSecrets API is blocked by Cloudflare challenge — official industry contribution codes were unavailable without manual registration.
Off-cycle candidates: Warner (2026) and Van Hollen (~2028) were not 2024 candidates; their FEC figures reflect off-cycle committee maintenance.
Data Sources & Citations
Source
Data Used
Status
BLS QCEW
Average annual wages, covered employment
✅ LIVE
USDOL / State DOL Statutes
SUI wage bases, max weekly benefits, disregard thresholds
✅ VERIFIED
DOL UI Financial Data
Historical effective SUI tax rates by state/year
✅ VERIFIED
HUD Fair Market Rents
FMR by metro → weekly housing proxies
✅ VERIFIED
FEC Open API (v1)
Campaign receipts, Schedule A itemized contributions
✅ LIVE
Census ACS 2022
Median household income by congressional district
✅ LIVE
Congress.gov
Committee assignments, member metadata (119th Congress)
⚠️ RATE-LIMITED
BLS LAUS — Local Area Unemployment Statistics
State + county unemployment rates (2010/2018/2026) — county choropleth map
✅ LIVE
USASpending.gov
Federal UI grants by state (CFDA 17.225) — spending accountability analysis
✅ LIVE
FRED (St. Louis Fed)
CPI-U, DC metro CPI (CUURA311SA0), PCE — independent inflation cross-validation